
|
Street Class Unlimited Class
DOHC SOHC Ion Updated 1/05 For the most recent list of the fastest five cars click here. |
Deciphering Compressor Maps - Page 3by: TitanOriginally I provided a formula to find your engine's airflow requirements, which represented the x-axis on the compressor map. This formula solved for the airflow requirements of any naturally aspirated (N/A) engine but it did not take into account the additional airflow a turbo provides. As rpms increase the turbine, inside the turbo, spins faster forcing a larger amount of air into the engine. Without getting into a lot of mathematics that compensate for ambient inlet temperature, compressor efficiency, and turbo outlet temperature we can get a general idea of what the total airflow will be. In order to determine the amount of airflow a turbo will provide take the N/A airflow requirement based on rpm (data located in the table titled "1.9 liter engine" on page 2) and multiply it by the pressure ratio (data located in the table titled "common pressure ratios" also on page 2). For example, if you wanted to find the amount of airflow of a 1.9 liter engine at 2000rpms and 5psi of boost the formula would look like this: 3.94 x 1.34 = 5.28 lbs/min In the equation above 3.94 represents the N/A engine airflow requirement (lbs/min) at 2000rpms and 1.34 is the pressure ratio at 5psi. Another example: 9.84 x 1.82 = 17.91 lbs/min Where 9.84 is the N/A engine airflow requirement (lbs/min) at 5000rpms and 1.82 is the pressure ratio at 12psi. The table below is based on boost levels at rpm. lbs/min of airflow
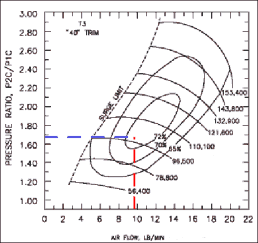
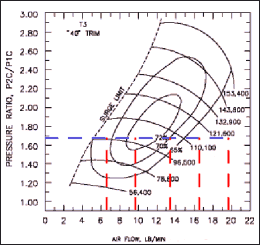
In this example I have plotted a point on the t3 "40" trim compressor map. The red dotted line represents the engine air flow with turbo while the blue dotted line shows the pressure ratio value. The efficiency is determined by where these two lines intersect. In the example below I have plotted the engine's airflow at 3000rpm (9.93 lbs/min) and the pressure ratio at 10psi of boost (1.68). As you can see from the graph above the compressors efficiency at 10psi of boost is 72%. Additionally, you can determine from the graph that the turbine has to spin over 96,000 rpms to produce that level of boost. Using the same compressor map, the graph below has all of the data points plotted at a desired 10psi boost level. As you can see from the graph at 2000rpm the turbo is 65% efficient but if you increase the engine's rpms by 1000 the turbo becomes even more efficient (72%). At 3000rpms the turbo has reached its peak efficiency. Increasing rpms to 4000 the turbo's efficiency has dropped back down to about 65%, even though the turbo is less efficient at this rpm it's still producing more lbs/min of airflow than at 3000rpms. Anything beyond 4500rpms and the data points begin to fall off the map, which means that the turbo can no longer supply the engine with the required airflow. In this example it would not be a wise decision to boost 10psi on a t3 40 trim.
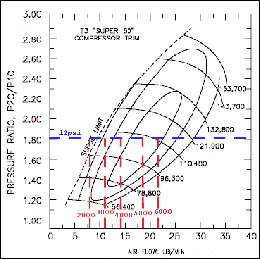
The example below shows a t3 "super 60 trim" compressor map. The data points are plotted at a desired boost level of 12psi. There are no efficiency numbers on this graph but that is not important since we know the middle "island" within the map is the most efficient. Right away we see that at 2000rpms the data point is to the left of the surge limit line. This is normally a bad thing but considering that the turbine is still spooling up it's acceptable. This looks like a much better match for the 1.9 liter engine's airflow rates the the 40 trim and I would say that you should be very happy with this turbo. Just remember there are many more variables to consider before purchasing a turbo for your car so, be sure to explain your needs to the company before you shell out your hard earned cash. |
|


